ところでなんですが、ggplotで特に何も指定せずに棒グラフを描くと、
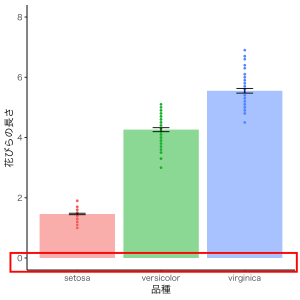
こう、x軸とy = 0ところの間に隙間(赤枠で囲ったところ)ができてしまうの、気になりませんか?棒グラフ、地に足をつけてほしいなと思います。
ということで、いつものコードにちょっと一言付け足しましょう。これまで(上の図)と同様にirisデータを使います。
# 使用するパッケージの読み込み
library( ggplot2 )

# グラフの基本設定
ggplot() + theme_set( theme_classic(base_size = 12, base_family = "Hiragino Kaku Gothic Pro W3") )

b4 <- ggplot( iris, aes( x = Species, y = Petal.Length, fill = Species ) ) +
    geom_bar( position = position_dodge( width = .9), stat = "summary", fun = "mean", alpha = .5 ) +
    geom_point( aes( color = Species ), size = .2, shape = 21, stroke = 1 ) +
    stat_summary( fun.data = "mean_se", geom = "errorbar", width = .2) +
    labs(x = "品種", y = "花びらの長さ" ) +
    scale_y_continuous( breaks = c( 0, 2, 4, 6, 8 ), limits = c( 0, 8 ), expand = c( 0, 0 ) ) +
    theme( legend.position = "none" )

plot( b4 )
scale_y_continuous()の中に「expand = c( 0, 0 )」を加えました。そうすると、
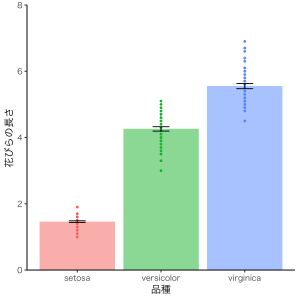
こんな風に、x軸とバーの間に隙間のないグラフを描くことができました。
以上、棒グラフの隙間をなくす書き方でした。