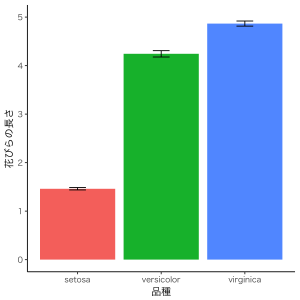
今回は横軸を品種、縦軸を花びらの長さとした棒グラフを描いてみたいと思います。
まずは基本形です。
# Environmentにirisを置いておく
data( "iris" )

# Valuesとして読み込まれる
str( iris )

# ValuesからDataになる
head( iris )

# ggplot2の読み込み
library( ggplot2 )

# グラフの基本設定
ggplot() + theme_set( theme_classic(base_size = 12, base_family = "Hiragino Kaku Gothic Pro W3") )

# 描画
b <- ggplot( iris, aes( x = Species, y = Petal.Length, fill = Species ) ) +
  geom_bar( position = position_dodge( width = .9), stat = "summary", fun = "mean" ) +
  stat_summary( fun.data = "mean_se", geom = "errorbar", width = .2) +
  xlab( "品種" ) +
  ylab( "花びらの長さ" ) +
  scale_y_continuous( breaks = c( 0, 1, 2, 3, 4, 5 ), limits = c( 0, 5 ) ) +
  theme( legend.position = "none" )
plot( b )irisデータの読み込み、ggplot2の読み込み、グラフの基本設定を前回と同様に行います。
描画では、まずx軸を何にするか、y軸を何にするかを指定してあげます。また、fill = Speciesとすることで、品種ごとにバーの色を変えるようにしました。
そして、positionで棒と棒の隙間の大きさを指定し、statとfun.yで平均値を示すことを指定します。次の行ではエラーバー(SE)をつけています。
最後に、x軸y軸の名前と、y軸で表示する数値を指定します。また、themeで凡例を表示しないようにしました。
こうしてplot()したグラフがこちらです。

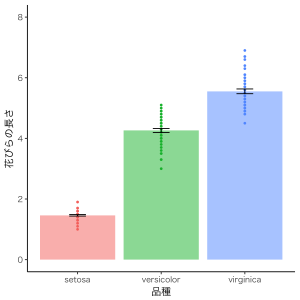
平均値とSEだけじゃなくて、もうちょっと情報を乗せたいな〜ということがあるかと思います。私はよく各グループに含まれる1つ1つのデータのプロットを棒グラフに重ねます。
# 描画
b <- ggplot( iris, aes( x = Species, y = Petal.Length, fill = Species ) ) +
  geom_bar( position = position_dodge( width = .9), stat = "summary", fun = "mean", alpha = .5 ) +
  geom_point( aes( color = Species ), size = .2, shape = 21, stroke = 1 ) +
  stat_summary( fun.data = "mean_se", geom = "errorbar", width = .2) +
  xlab( "品種" ) +
  ylab( "花びらの長さ" ) +
  scale_y_continuous( breaks = c( 0, 2, 4, 6, 8 ), limits = c( 0, 8 ) ) +
  theme( legend.position = "none" )
plot( b )
主な変更点は以下の2点です。
まず、geom_bar()の中にalpha = .5という記述を追加しました。棒の色を少し透過させています。データのプロットが見えやすいようにするためです。
そして、geom_point()を追加しました。これで棒の上にデータがプロットされます。サイズや形、輪郭の太さなどは好きなように変更してください。
こうしてplot()したグラフがこちらです。

データをプロットすることで、データの分布はどうなっているのかが、わかるようになりました。
描いたグラフは保存しておきましょう。
savePlot = function( data, name, dpi, width, height ){
  ggsave( plot = data, file = name, dpi = dpi, width = width / dpi, height = height / dpi )
}
savePlot( g, "plot1.png", 300, 1500, 1500 )
savePlot( b, "plot2.png", 300, 1500, 1500 )前回、savePlot = を使ってグラフ保存コーナーを作っていました。前回のグラフgの下に今回のグラフbを並べて、保存を実行することができます。
以上、棒グラフでした。